- What it is
- A tool that takes every parking lot in a New York county from OpenStreetMap, grabs a satellite image of each one, and scores how empty it looks.
- Why I made it
- I wanted to know how much of a city is paved over for parking that nobody is using, and all the data to answer that is public.
- What I did
- I built a FastAPI and React app that runs a whole county as a job you can pause and resume, scores each lot with OpenCV, and exports the results for ArcGIS.
- How it turned out
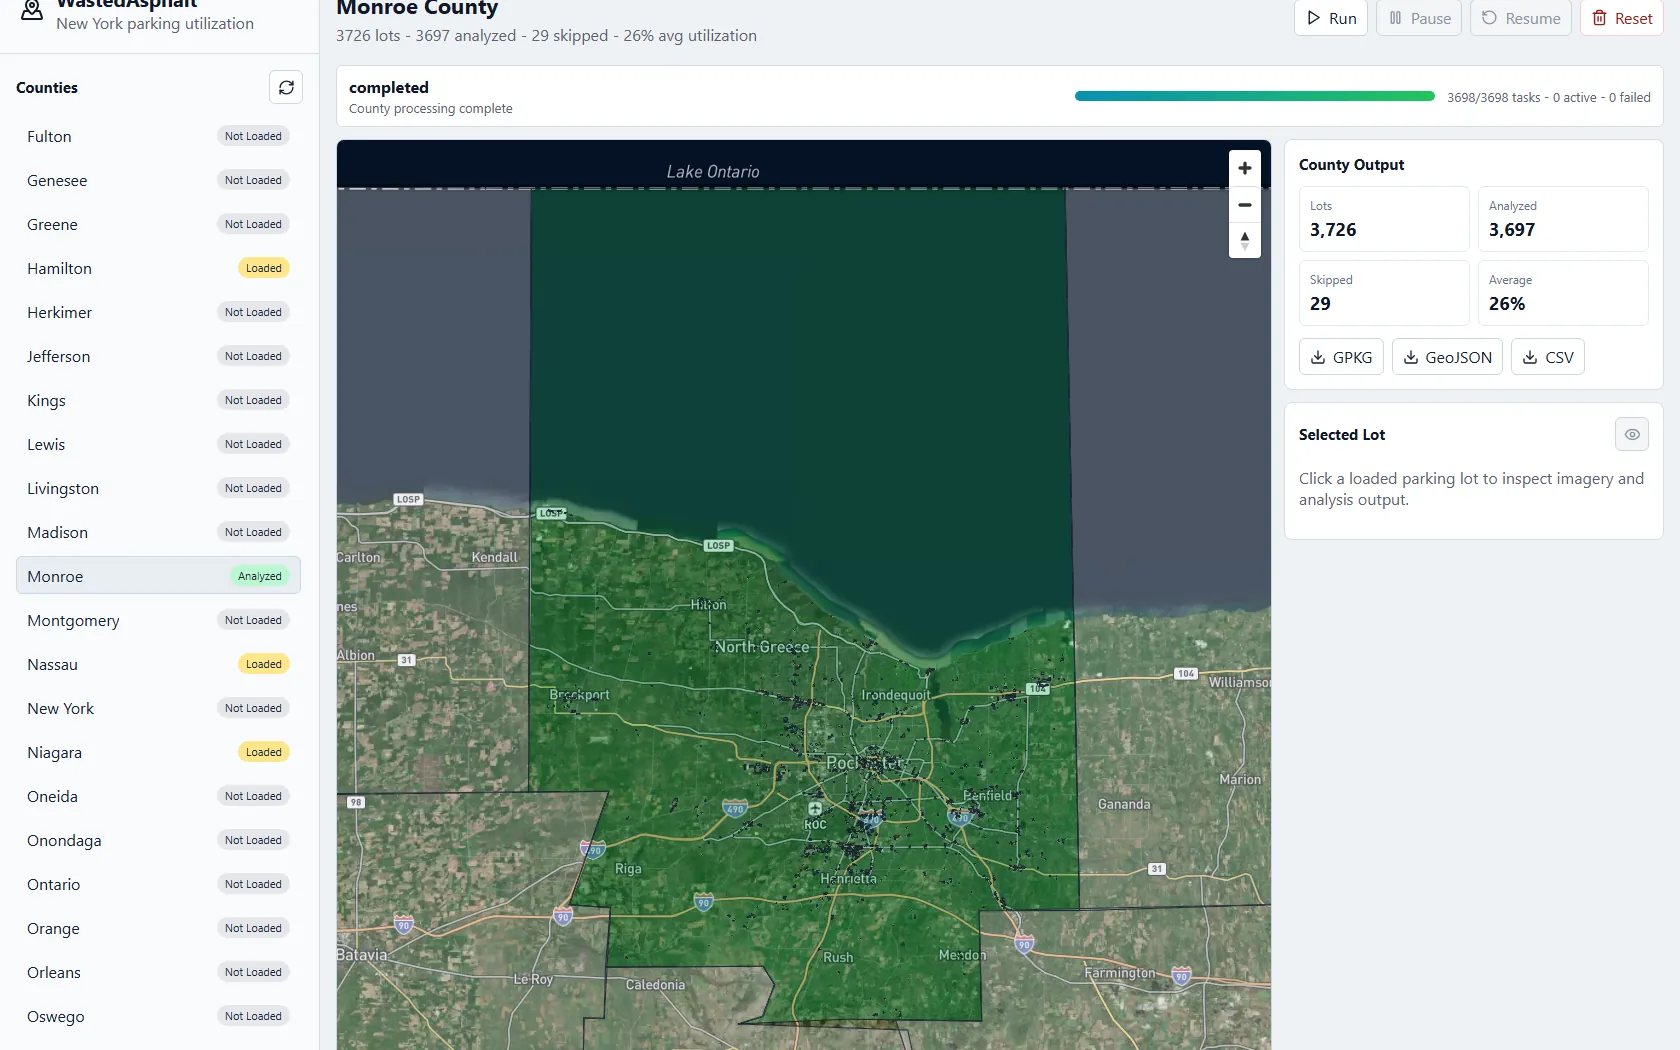
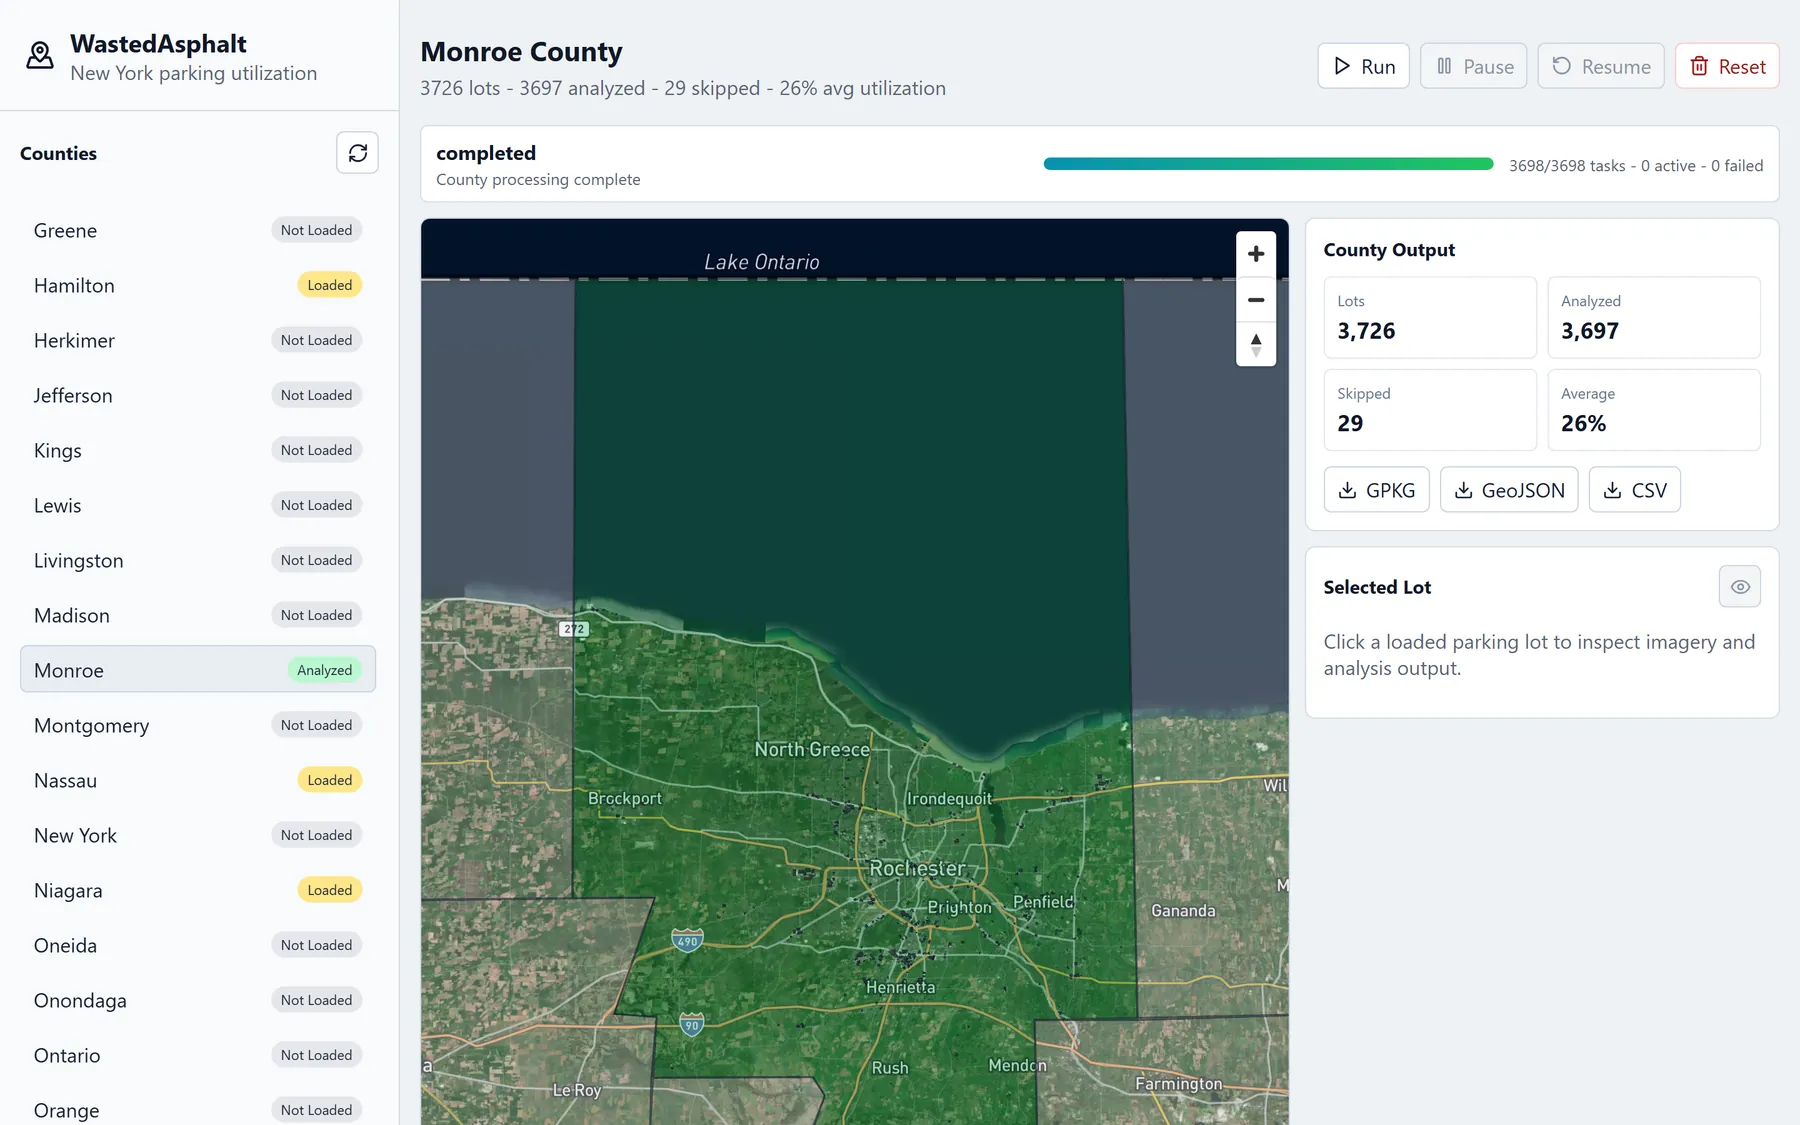
- Monroe County came out to 3,726 lots with a 26% average score. The score is a simple color trick, not a car detector, so painted lines and shadows count too.
The details
The idea
Everything you need to answer that question is public. The Census has county boundaries, OpenStreetMap already has parking lots drawn as shapes, and satellite images are one request away. WastedAsphalt connects those three and puts a number on every lot. For Monroe County it analyzed 3,697 lots (29 were skipped) in about eleven minutes.
Every lot, colored
When a county finishes, every lot shows up on the map colored by its score, from green to red. Downtown Rochester is where it gets interesting. The results export straight into ArcGIS, so they can be compared with other city data.
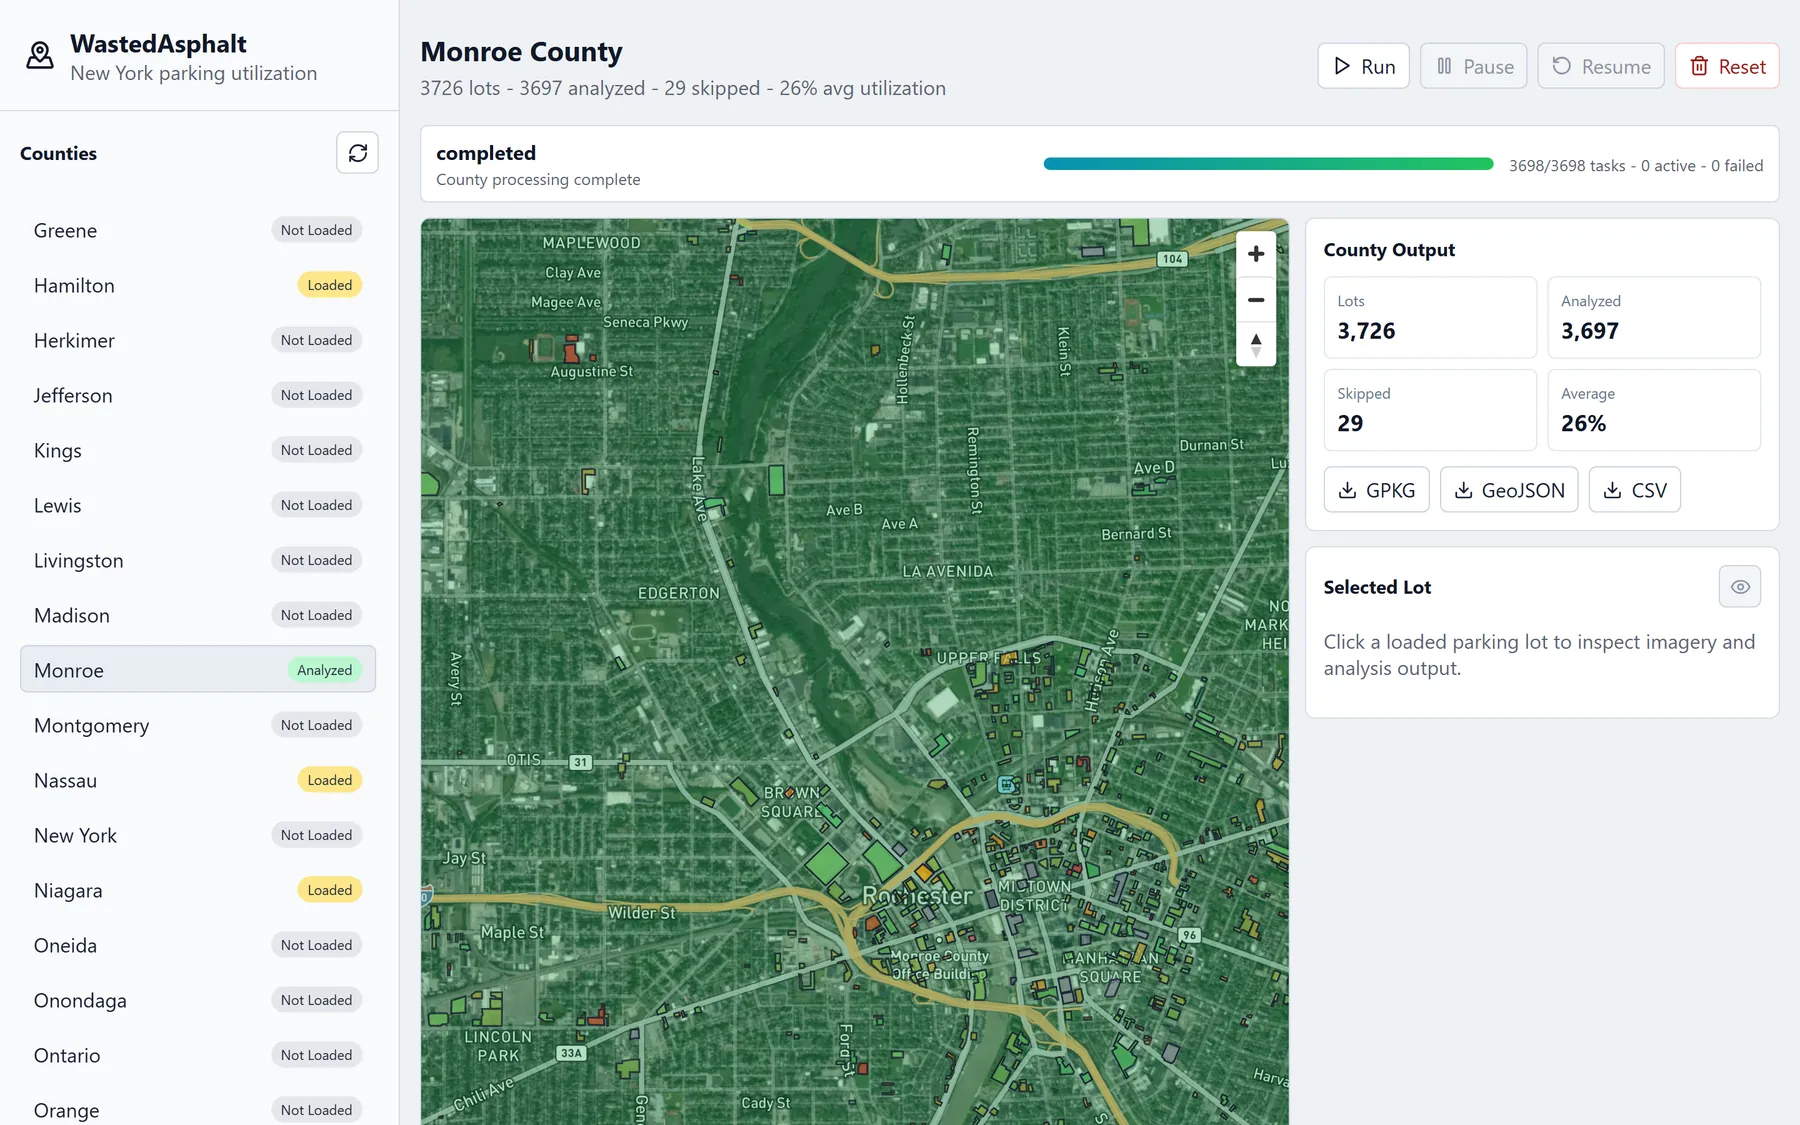
Downtown Rochester, one colored shape per lot. 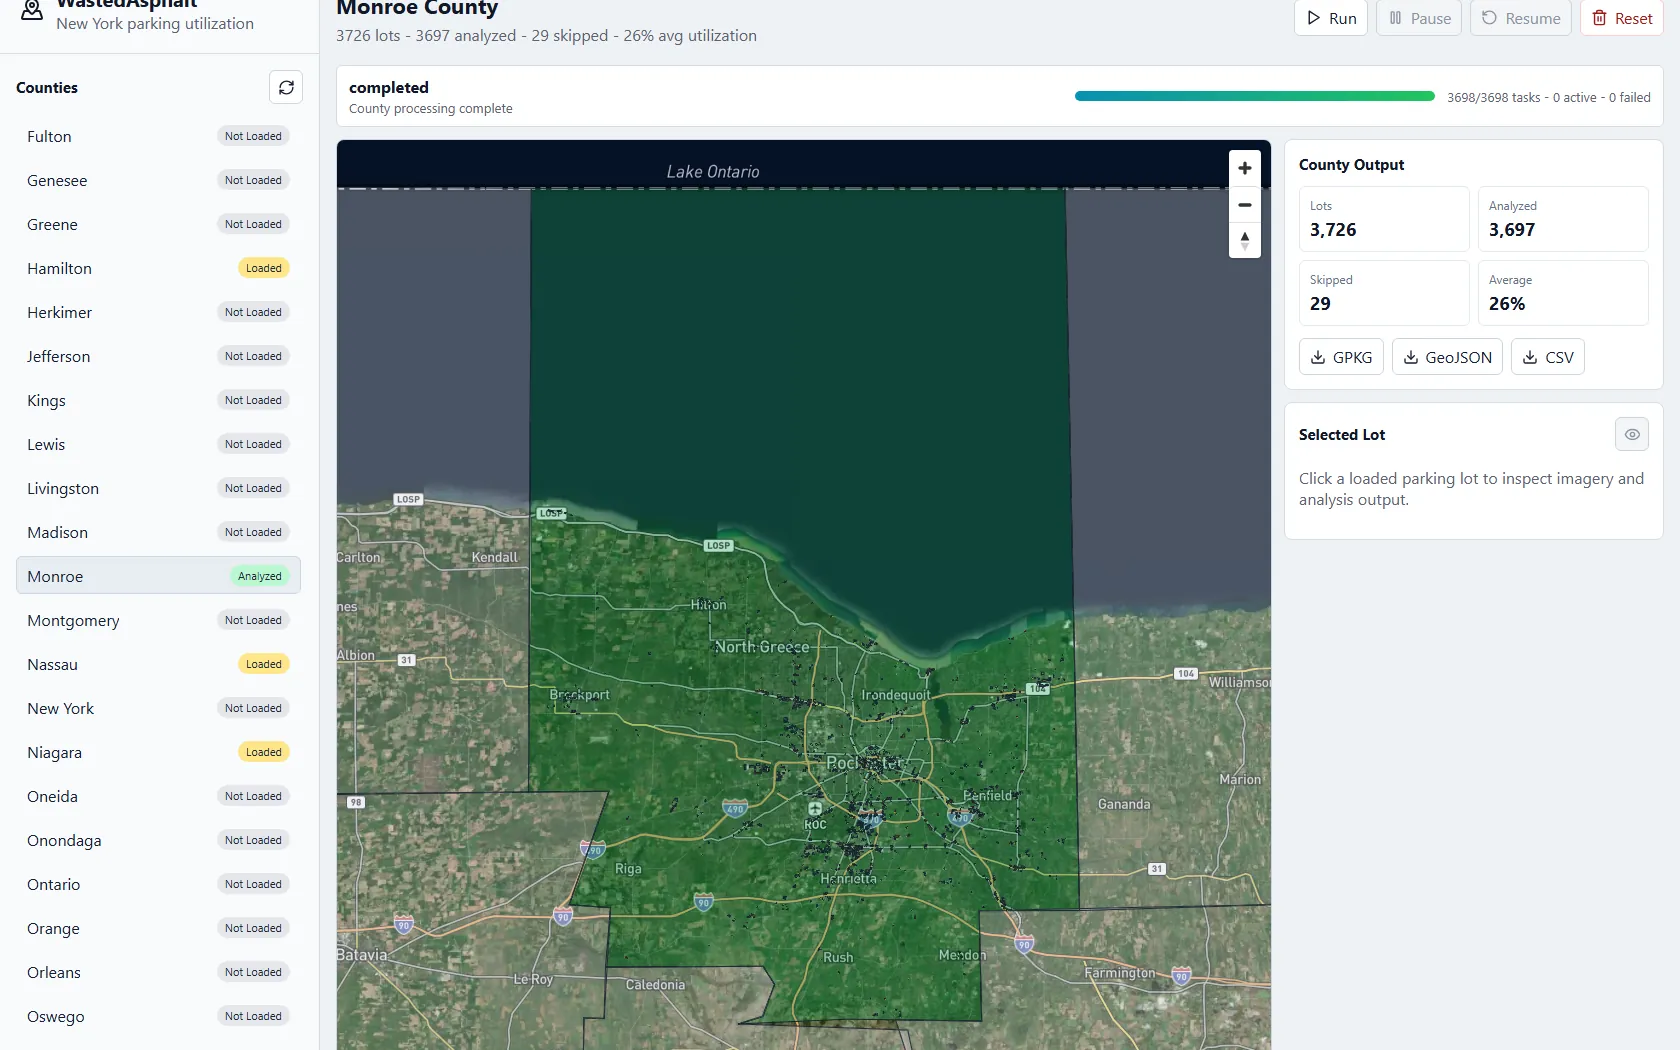
The whole county, finished.
How a lot gets scored
For each lot, the program finds the usual color of its asphalt and then measures how much of the lot is a different color. That's the score. The catch is that it isn't really counting cars. Painted lines, shadows and patches count too, so the lot below scored 0.91 even though it's maybe a third full. It's a simple color trick, not a trained car detector.
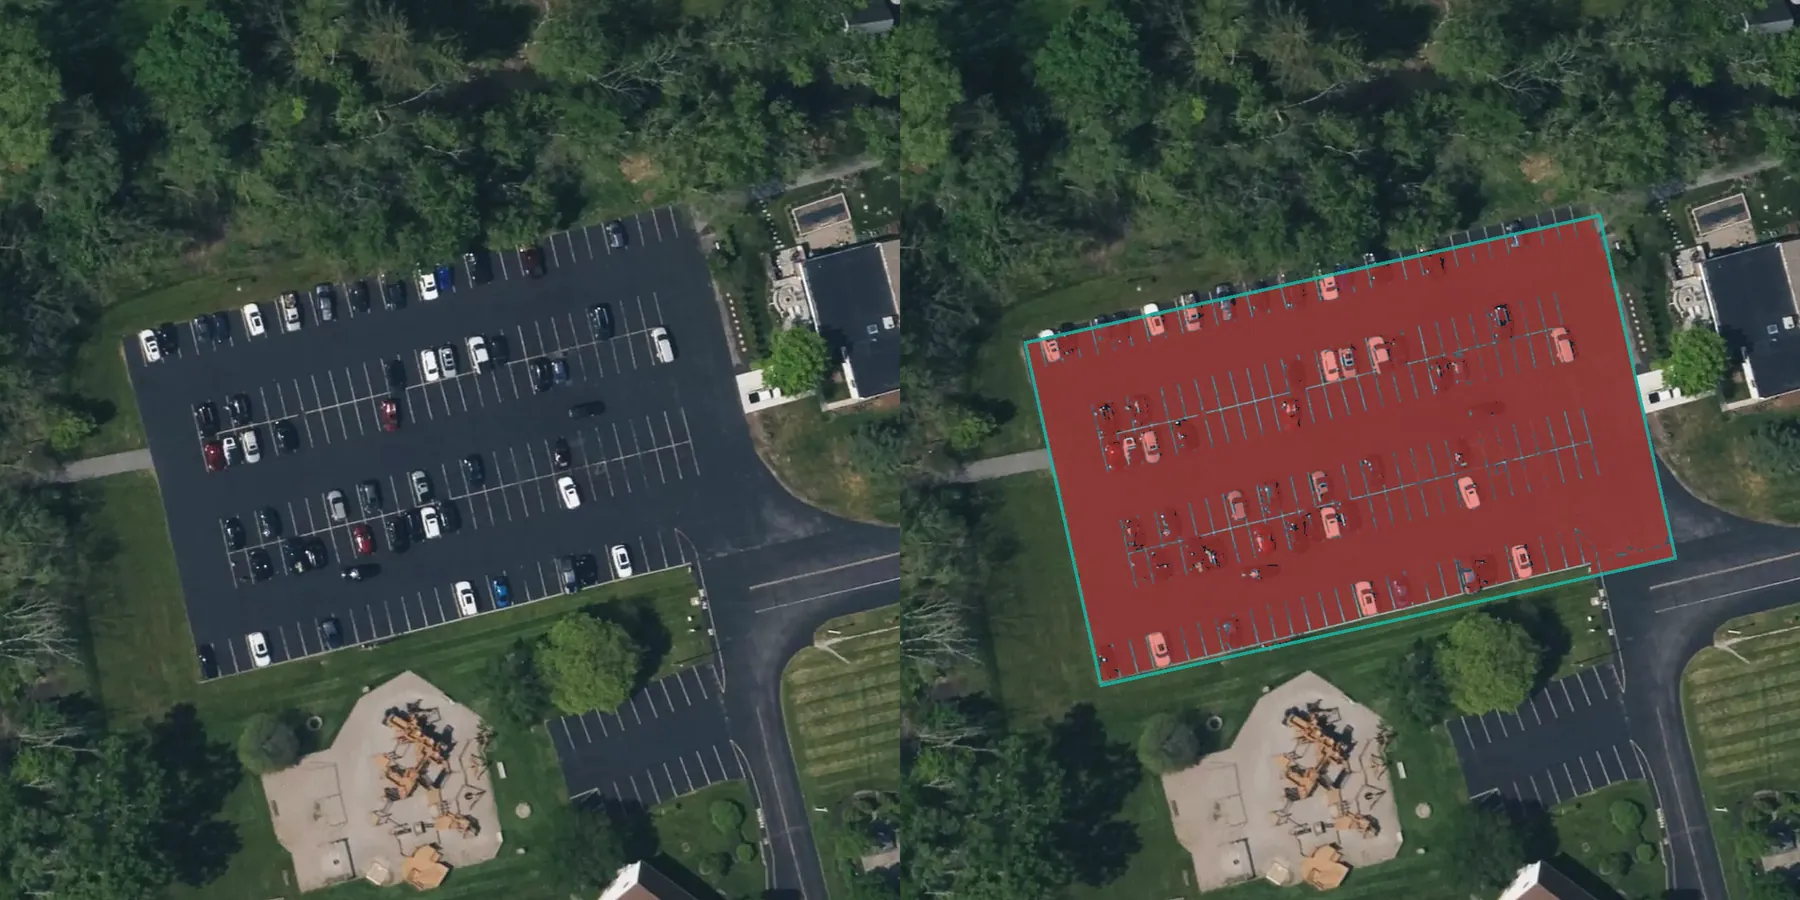
The satellite image, and what the program counted. The painted stripes push the score up. 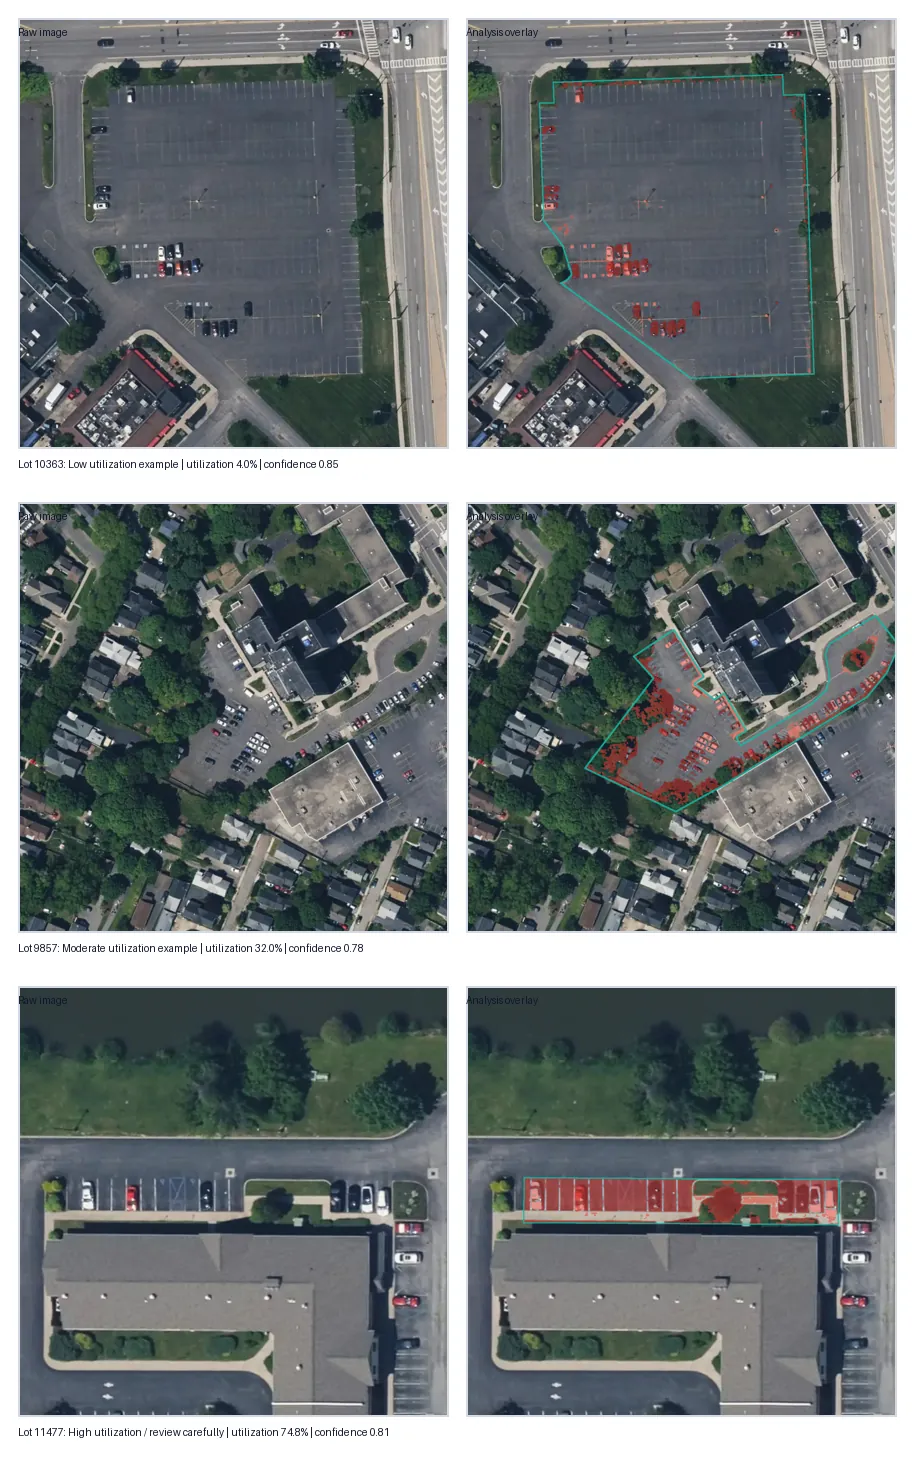
A few more lots and their overlays.
Running a whole county
A county is thousands of image downloads, so the job can be paused and resumed, and it picks up where it left off even if the program crashes. Images are saved too, so running a county again doesn't download them twice.